Markets 6.27.2026
SP 500
SP 500
SP 500
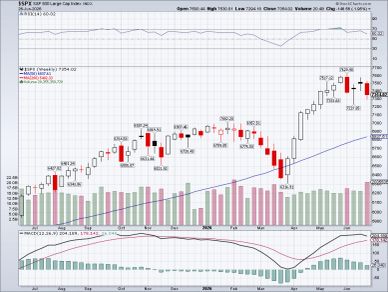
The SPX weekly chart was Down
1.95% last week.
The market was down this week. Prices are high, and tried to come back Friday afternoon, finishing near the 50DMA. Weekly charts are pointing down, holding around the 50WMA.
Iran war issues, news on new bombings this weekend in violation of peace treaties will move markets.
5 year seasonal trends have the SPX up 75% of the time in June, then 100% of the time in July, before August, September, and October bring a 50% chance of higher prices or drops.
Proceed with caution, War news can move these markets, as the peace treaties have not lasted long, we assume they can go back to bombs at any time. We will look for the markets to move either way right now, no definite direction, lower has the edge with war news escalating.
If you want to own this web sight, make me an offer. (at least $20,000,000)
QQQ
SP 500
SP 500
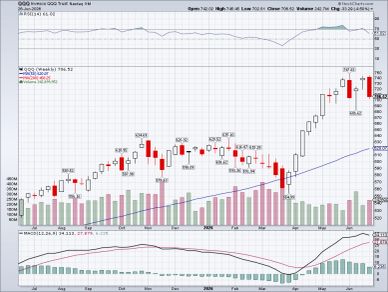
The QQQ was Down 4.5% last week.
Seasonal trends for the past 5 years show QQQ UP 75% of the time in June and July, then 50% of the time in August, September and October.
Charts are high, news from the MU earnings, popped the semis A LOT Thursday, but they came down well off the highs.
Tech, semis, memory stocks have been on fire. They are high and charts have come back down from highs some. Charts are mixed, but the edge goes to lower prices. DRAM stocks have been dominating, software stocks started UP off of lows Friday. A shift in the tech space now might take place, as well as Biotech, Health have been moving higher.
I call this DAY TRADERS PARADISE, and that statement continues.
Semis
SP 500
Consumer Discretionary
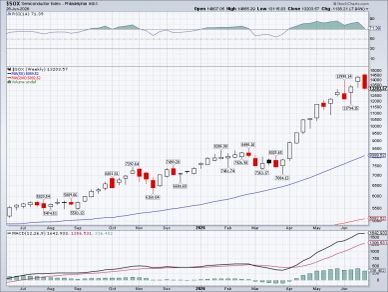
The SOX was Down 7.94% last week.
Semis are high, looking to go?
The weekly lows were erased Thursday with the MU earnings POP, then new lows were established Friday. Semis and DRAM are hot, but is this a correction for the group, or a pause and rotation back into software etc.
5 year seasonal trends show SEMIs higher 75% of the time in June and July, only 25% in August. May has been the best month, up 100% of the time for the past 5 years.
I call this DAY TRADERS PARADISE, and that statement continues.
Consumer Discretionary
Consumer Discretionary
Consumer Discretionary
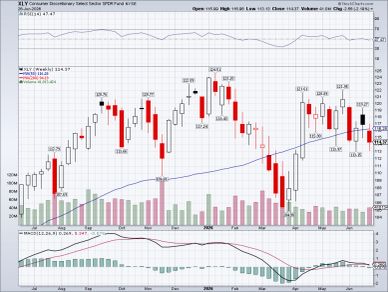
XLY was Down 2.13% last week.
XLY moved higher Friday, while other indexes dropped. Is this just a shift back into laggards during the DRAM rocket higher?
Seasonality has XLY up 75% in June, and 100% in July, then only 25% in August.
Minimum wage for me is $5,000,000,000. Based on my BS MS ACT GMAT%, efforts, american Pay check/business license precedents.
Energy
Consumer Discretionary
Junk Bonds
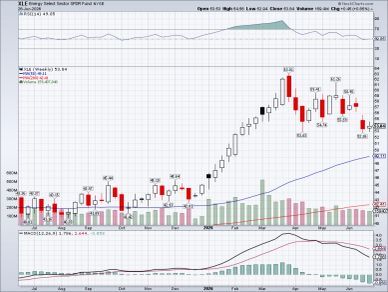
The XLE was Up .85% last week.
Oil is moving down. (I paid $52 to fill up 13 gallons tonight, vs $61 a few weeks ago).
As long as the peace treaty is in effect with Iran, oil should go lower. These 'agreements' are subject to change as they have gone back and forth for months.
Junk Bonds
Consumer Discretionary
Junk Bonds
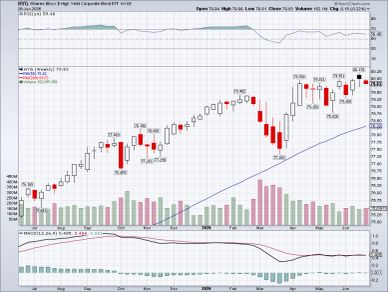
HYG Junk, high yield bonds, indicating Risk 'on' or 'off'.
HYG was Down .22 last week. The relative small moves keep risk and the market in a drift higher. A possible break down is coming, but until it does, we assume higher prices.
Seasonal trends are up 75% in June, 100% July, 75% August, 50% September, then only 25% in October.
The black candle Top indicates junk going lower, with the general market.
20 Year Treasury Bond
20 Year Treasury Bond
20 Year Treasury Bond
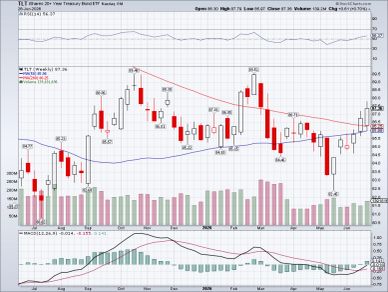
The TLT goes UP when interest rates are going lower, and the SPX generally goes UP with the TLT these days.
TLT was Up .70% this week.
P&F charts have a Bearish target of 77 now.
Seasonal trends are
June up 75%
July, August, September- up 50%
October 25%
November 100%
December 25%
Volatility Index
20 Year Treasury Bond
20 Year Treasury Bond
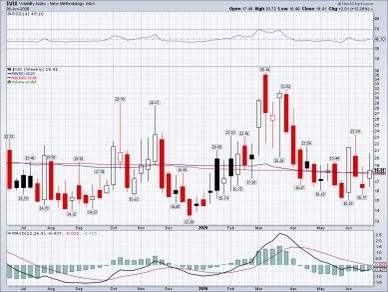
$VIX- increases in Volatility lead to lower stock prices.
VIX was Up 12.26% last week.
Volatility came down Friday, well off of the weekly highs.
Oil and Iran issue will dictate volatility.
Seasonal trends show VIX up 25% in June
50% in July
25% in August
100% in September
75% in October
So we might expect the markets to continue higher until traditional corrections hit in September and October. 'who knows for sure, anything can happen, so anything will happen/break history'
Gold
20 Year Treasury Bond
Silver
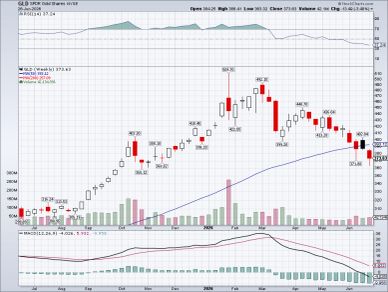
Gold was Down 3.48% last week.
Gold started to move higher from a bottom Wednesday.
Seasonal trends show -
June Up 25%
July 50%
August 50%
September 50%
Silver
Bitcoin
Silver
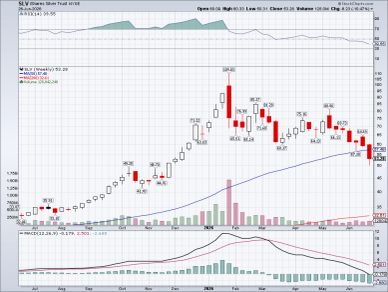
Silver was Down 10.47% last week.
P&F charts show SLV down to 36.
Seasonal 5 year trends are Silver UP
June 25% of the time
July 75%
August 25%
September 75%
October 100%
Copper
Bitcoin
Bitcoin

Copper was Down 3.67% last week.
Up after lows Wednesday like Gold and Silver.
P&F charts have copper going higher, to 7.75
Dr. Copper, a signal for basic industrial growth.
Seasonal trends are UP-
June 50%
July 25%
August 25%
September 50%
October 25%
November 75%
December 75%
Bitcoin
Bitcoin
Bitcoin
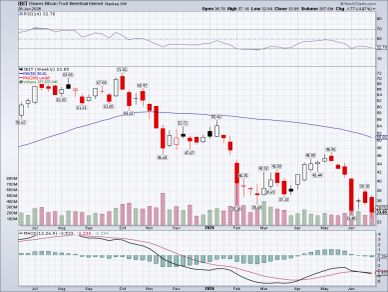
Bitcoin was Down 4.97% last week.
Bitcoin moved UP off of a low Friday, July is one of the best months for Bitcoin.
Bitcoin has been weak. P&F charts have a target down to 22.
3 years of seasonal trends show
UP
June 50%
July 100%
August 0%
September 100%
October 50%
The War/Iran/Oil issues continue to keep uncertainty alive.
Volatility looks to be in the forecast for next week.