Markets 10.16.2026
SP 500
SP 500
SP 500
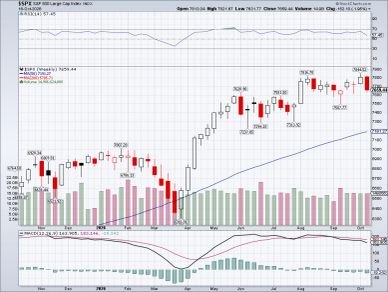
The SPX weekly chart was Down 1.95% last week.
SPX has been trending sideways for weeks. Last week a Top signal was established and the SPX indeed had a fairly large drop off this past week.
5 year seasonal trends have the SPX are
October Up 60%
November UP 100%
December Up 25%
P&F charts for the SPX are still, going UP to 8749.
The CBOE SPX Put/Call Ratio stands at 1.46 as of the market close on October 16, 2026. This represents a notable spike from recent readings earlier in the week, driven by dropping stock prices as the S&P 500 fell 1.09% to close at 7,659.44. [1, 2]
A reading of 1.46 reflects highly bearish market sentiment and elevated fear. In index options trading, a put/call ratio well above 1.0 indicates that investors are heavily purchasing protective puts relative to bullish call options, typically indicating a strong demand to hedge against macro or sector-specific downside risks.
(These charts are based on basic price trends and trading volume. They are not an exact science 100% of the time, but a very worth while stock market gauge. Fundamentals are earnings and sales, and sometimes these trend charts reveal a truth perhaps hidden by accounting statements. The options data is assumed to be accurate, but with a caution that many times exact numbers are not always 100% correct. The options data reveal information that can be useful in determining stock market, ETF, individual stock direction. Nothing is 100% accurate 100% of the time, nothing is in life...)
If you want to own this web sight, make me an offer. (at least $20,000,000)
QQQ
SP 500
SP 500
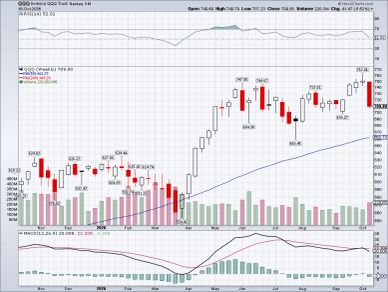
The QQQ was Down 5.52% last week. 'QQQ looks to be losing steam from tech, semis this week. Perhaps a rotation from tech into lower performing groups like Financials, Retail and Staples, is coming on.'- Last week's statement held true as tech and semis fell further, Staples, WMT, KO had good moves to highs. Defensive stocks moved to the front of the pack.
P&F charts have changed again, QQQ going Up a little bit more to 884.
Seasonal trends for the past 5 years show QQQ Up 60% of the time in October. November is UP 75%, 50% in December.
The Invesco QQQ Trust (QQQ) closed at $709.80 on Friday, October 16, 2026, registering a sharp decline of 2.50% (-$18.20). The slide was part of a tech-heavy risk-off rotation that saw the broader Nasdaq-100 index pull back amid rising yields and questions over stretched AI valuations.
Derivatives & Options FlowOptions market activity highlights a significant structural divide between immediate volume flows and resting position positioning:
- Options Volume Put/Call Ratio: Stood at 0.97 for the session. Daily options volume clocked in at 5.44 million contracts, reflecting a highly active but relatively balanced day-of trading sentiment between new call buyers and put buyers. [1]
- Open Interest (OI) Put/Call Ratio: Reached 1.51. This metric measures total existing open derivatives positions, and its heavily skewed level indicates a persistent, underlying bearish structural posture or extensive macro tech hedging by institutions. [1]
- Volatility Environment: Implied Volatility (IV) on the fund sits at 21.19%, placing it at an IV Rank of 42.76%. [1]
Key Performance Levels
- 52-Week Trading Range: $555.60 to $762.86
- Intraday Trading Range: $707.23 to $725.96 on elevated volume of 66.93 million shares [1]
I call this DAY TRADERS PARADISE, and that statement continues.
Semis
SP 500
Consumer Discretionary
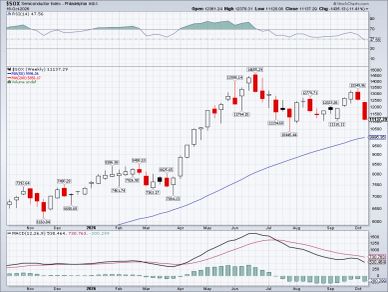
The SOX was Down 11.41% last week.
We could be at a short term top, or just a pause in the over all move higher. Fundamental reports remain positive for semis and tech, with perhaps more competition coming on among top names.- Last week's statement held true, semis had a large drop. Momentum is taking the group lower.
P&F charts are now pointing lower, a change again from last week, Down to 11,651. The P&F charts are changing signals almost weekly, thus as a long term target, are not of much use now.
5 year seasonal trends show SEMIs higher 60% of the time in October, 50% in November, then Up 75% of the time in December.
The PHLX Semiconductor Index (SOX) plunged 3.83% (-$443.93) to close at 11,137.29 on Friday, October 16, 2026. The sharp drop marked an eighth consecutive daily decline for the semiconductor benchmark—its longest losing streak since the 2008 financial crisis—wiping out roughly $2 trillion in collective market value over that span.
Derivatives & Options Flow (via SOXX ETF)Because the underlying index cannot be traded directly, institutional hedging and retail flow are best observed through its primary vehicle, the iShares Semiconductor ETF (SOXX), which slid 4.14% to $493.39: [1]
- Open Interest Put/Call Ratio: Sitting heavily skewed at 1.92. This immense structural backlog highlights extensive protective put accumulation by institutions looking to hedge against severe AI sector downside. [1, 2]
- 30-Day Implied Volatility (IV): Hovering around 35%, indicating that options traders are pricing in accelerated day-to-day variance compared to earlier historical baselines. [1]
Sector FactorsThe extended sell-off stems from growing market skepticism over stretched near-term corporate earnings relative to the multi-year capital expenditures dedicated to the AI boom. Over half of all equity components within the SOX index are now down at least 10% from their respective local highs. [1, 2]
Consumer Discretionary
Consumer Discretionary
Consumer Discretionary
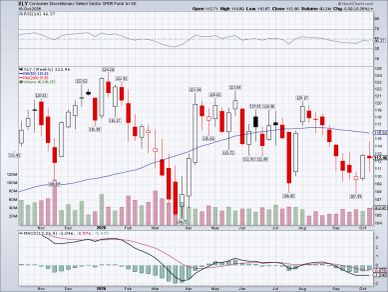
XLY was Down .35% last week.
XLY is moving in the range of 105-121 since April. The group was relatively calm compared to other sectors with a wide weekly range finishing close to even.
Seasonality has XLY up .
50% of the time in Oct. then 75% Nov/Dec.
P&F charts are pointing lower to 87.
The Consumer Discretionary Select Sector SPDR Fund (XLY) dropped 0.84% (-$0.95) to close at $112.46 on Friday, October 16, 2026. The sector fund showed relative resilience compared to tech and semis (which shed 2.5% to 4%), momentarily benefiting from a minor defensive rotation into beaten-down retail names.
Derivatives & Options Flow Options market metrics indicate that while defensive hedges are securely anchored, immediate session panic remained contained:
- Open Interest (OI) Put/Call Ratio: Sitting at 2.10. This heavily elevated open interest profile shows that longer-term institutional positions remain structurally weighed down by protective puts, preparing for continued economic or consumer sentiment macro headwinds. [1]
- Recent Volume Put/Call Ratio: Trailed near 1.30 for recent active sessions, reflecting a steady pick-up in defensive put buying over day-to-day call options as spot prices rolled over. [1]
- Volatility Metrics: Implied Volatility (IV) on the fund sits at 20.52%, registering an IV Rank of 23.24%. [1]
Underlying Concentration Risks XLY's performance continues to be disproportionately dictated by its massive, cap-weighted top two holdings: [1]
- Amazon (AMZN): ~23.39% allocation
- Tesla (TSLA): ~17.67% allocation
- Home Depot (HD): ~5.01% allocation [1]
Minimum wage for me is $5,000,000,000. Based on my BS MS ACT GMAT%, efforts, american Pay check/business license precedents.
Energy
Consumer Discretionary
Junk Bonds
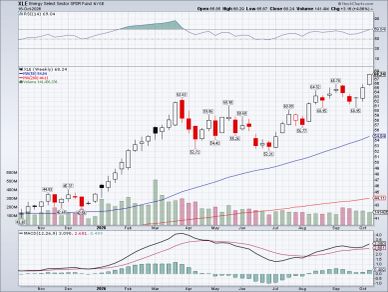
The XLE was Up 4.86% last week.
Oil moves on peace treaties on or off with Trump/Iran. This has been so for months. Do not count on anything for now.
P&F charts are pointing higher to 78.
The Energy Select Sector SPDR Fund (XLE) bucked the broader market's severe tech sell-off, surging 2.52% (+$1.68) to close at $68.24 on Friday, October 16, 2026. The sector found significant support from a stronger crude tape as geopolitics and supply risks kept a firm floor under oil prices, driving the fund to notch a fresh 52-week high.
Derivatives & Options Flow Despite the underlying equity's strong upward session, the options space remains heavily warped by massive institutional defensive positioning accumulated throughout the year:
- Session Volume Put/Call Ratio: Stood at 2.23. Total options activity cleared 158.21K contracts—roughly 106% of its daily baseline—with daily put volume significantly outstripping calls as players aggressively layered on tail-risk insurance. [1]
- Open Interest (OI) Put/Call Ratio: Sitting historically elevated. The structural backlog of protective put options remains firmly anchored, reflecting an ongoing hedge against potential profit normalization or sudden reversals in geopolitical premium. [1]
- Volatility Profile: The 30-day Implied Volatility (IV) settled near 24.59%, which tracks at an IV Rank of just 5.14%, suggesting that current premium pricing is surprisingly cheap relative to the sector's historical swings.
Junk Bonds
Consumer Discretionary
Junk Bonds
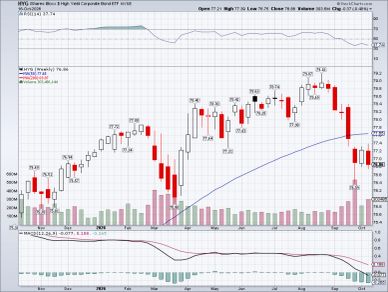
HYG Junk, high yield bonds, indicating Risk 'on' or 'off'.
HYG was Down .48% last week. This market is not predictable with international conflicts/news/on/off.
Seasonal trends are up only 40% in October. Up 100% in Nov, then 50% in Dec.
P&F charts are looking to go Up to 98.
The iShares iBoxx $ High Yield Corporate Bond ETF (HYG) closed at $76.86 on Friday, October 16, 2026, dipping 0.35% (-$0.27). While the equity market experienced severe tech-led liquidations, junk bonds saw a more measured pullback but continued to flash warning signs of systemic stress. [1, 2]
Derivatives & Options FlowThe options backdrop on HYG reflects highly aggressive corporate credit hedging as investors prepare for potentially widening yield spreads: [1]
- Daily Volume Put/Call Ratio: Peaked near 8.0 in recent sessions. Daily options volume cleared over 700K contracts—well above its historical average—with put buying massively outpacing call activity as traders rushed to purchase downside credit insurance. [1]
- Credit Quality Skew: Heavy open interest concentrations remain structurally anchored at the $76.00 and $75.00 put strikes, pointing to a major institutional defensive firewall. [1, 2]
- Volatility Pricing: Implied Volatility (IV) settled near 5.60% with an IV Rank of 21.24%. Even with the immediate spot price drop, options premiums are pricing in relatively subdued future premium expansion. [1]
20 Year Treasury Bond
20 Year Treasury Bond
20 Year Treasury Bond
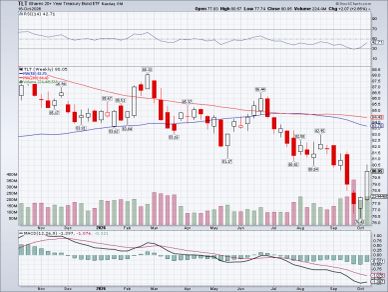
The TLT goes UP when interest rates are going lower. The moves lower may be about to reverse higher/lower rates, higher stock prices.
TLT was Up 2.65% this week.
P&F charts still have a Bearish target of 76.
Seasonal trends are
October 40%
November 100%
December 25%
The iShares 20+ Year Treasury Bond ETF (TLT) closed at $80.05 on Friday, October 16, 2026, marking a minor gain of 0.08% (+$0.06). While equity markets experienced severe tech-led liquidations, long-term bonds stood their ground as a defensive safe haven. This capped off TLT’s best weekly performance since March 2025, gaining 2.65% on the week after rebounding from a multi-year low of $76.43 earlier in October.
Derivatives & Options FlowIn direct contrast to the equity index ETFs (like QQQ or SPX) which have seen protective put buying skyrocket, TLT's derivatives activity reveals a heavy institutional preference for bullish call options as investors hedge against a broader economic slowdown:
- Session Volume Put/Call Ratio: Registered a low 0.28. Total options volume exploded to 2.22 million contracts—more than 204% of its daily baseline average—with massive call buying completely overwhelming put volume. [1]
- Open Interest Profile: For immediate upcoming cycles, the Open Interest Put/Call ratio rests near 0.46, underscoring a prevailing macro setup where market participants are positioned for interest rates to drop (which pushes bond prices up). [1]
- Volatility Environment: Implied Volatility (IV) on the fund sits at 14.21%, tracking at an elevated IV Rank of 67.34%. This implies that option premiums are relatively expensive as traders heavily bid up calls. [1]
Macro & Yield InflectionTLT’s sharp weekly reversal represents what technical analysts call a "news failure". Earlier in the week, hotter-than-expected CPI (3.7% annually) and PPI data initially spiked the 30-year Treasury yield to a multi-decade high of 5.73%. However, yields completely reversed, with the 30-year falling back to 5.44% by Friday. Capital markets effectively brushed off the hot inflation data, focusing instead on structural risks in the tech sector and a record $1.36 trillion gross debt-service spending report released by the Treasury. [1, 2, 3]
Volatility Index
20 Year Treasury Bond
20 Year Treasury Bond
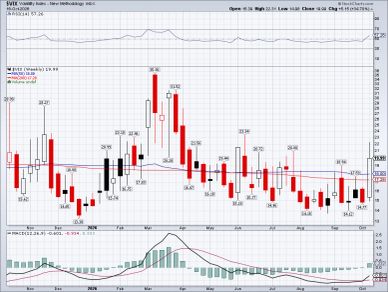
$VIX- increases in Volatility lead to lower stock prices.
VIX was Up 34.7% last week.
P&F charts have changed again now with volatility going Up to 22. (higher target. lower stock prices, back and forth over these past weeks)
Oil and Iran issues bad/good move volatility.
Seasonal trends show VIX up
60% in October
0% in November
50% In December
The CBOE Volatility Index (VIX) surged 21.45% (+$3.53) to close at 19.99 on Friday, October 16, 2026. The rapid ascent reflected a dramatic increase in expected near-term equity market swings as the index breached its multi-week ceiling and spiked as high as 22.31 intraday. [1, 2]
Derivatives & Options Metrics In direct contrast to equity index option complexes (where a high put/call ratio implies fear), a low put/call ratio on the VIX itself is often a sign of hedging anxiety. Traders buy VIX call options to bet on or insure against a broader stock market crash: [1, 2]
- Options Volume Put/Call Ratio: Fell to 0.32. This remarkably low print underscores that call option accumulation drastically outpaced put buying, indicating intense institutional demand for portfolio protection. [1, 2]
- Open Interest Structure: Total VIX options open interest is heavily weighted toward the call side, with massive clustering at the near-term $20.00 and $22.00 strikes. [1, 2]
Technical Context The intraday push above 22 is statistically significant. In quantitative trading, a VIX breakout past the 22 milestone often serves as a trigger for systematic, rule-based algorithmic models to dynamically deleverage and sell equity exposure, which exacerbated the broad-market liquidations witnessed across the S&P 500 and tech sectors during the session.
Gold
20 Year Treasury Bond
Silver
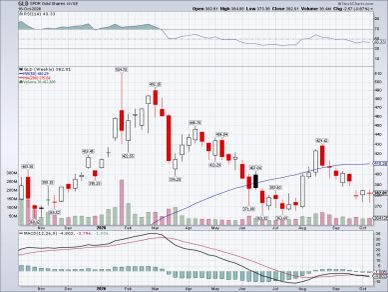
Gold was Down .67% last week.
Gold is moving below the 50WMA.
Weekly charts are about even for 3 weeks now.
P&F targets are still lower this week to 337.
Seasonal trends show Gold UP-
October 60%
November 75%
December 75%
The SPDR Gold Trust (GLD) ticked down slightly by 0.18% (-$0.70) to close at $382.01 on Friday, October 16, 2026. The minor slide occurred even as broader stock indices experienced severe liquidation, reflecting a complex tug-of-war between safe-haven buying and a macro environment weighted down by high interest rates. [1, 2, 3]
Derivatives & Options FlowUnlike equity index ETFs where a high put/call ratio reflects fear, commodity products like gold are structurally call-skewed due to long-term institutional accumulation. [1]
- Volume Put/Call Ratio: Settled at 0.96 for the session on a total volume of 397.07K contracts, indicating a completely balanced, neutral sentiment between day traders entering new call and put positions. [1]
- Open Interest (OI) Put/Call Ratio: Stands structurally low near 0.53. This long-term posture shows that outstanding bullish call contracts outnumber protective puts roughly two-to-one on the resting ledger. [1]
- Volatility Environment: Implied Volatility (IV) on the fund sits at 20.73%, mapping to a low IV Rank of 10.83%. This implies that despite massive day-to-day moves in technology shares, gold options premiums remain relatively cheap. [1]
Macro Mechanics & Underlying Bullion The underlying physical spot gold price hovered near $4,168 per ounce, staging a modest intraday recovery from its recent local lows. Bullion found near-term breathing room as the 10-year Treasury yield softened to 5.09% alongside a slight pullback in the U.S. Dollar Index. [1, 2, 3]Because gold pays no yield, it has faced broad pressure since late August when the Federal Reserve delivered a 25 basis point hike. Hotter-than-expected September CPI (3.7% YoY) and PPI reports this week have kept bond yields elevated, which continues to pose a structural competitive headwind for non-yielding precious metals. [1, 2]
Silver
Bitcoin
Silver
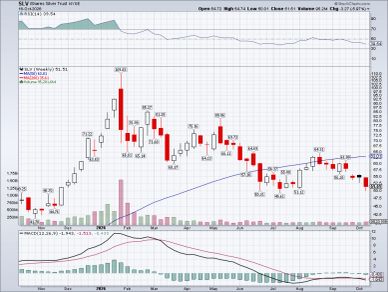
Silver was Down 5.97% last week.
P&F charts are the same, SLV lower to 53.
The iShares Silver Trust (SLV) slipped 0.55% (-$0.26) to close at $46.73 on Friday, October 16, 2026. Silver mirrored the marginal weakness seen in the gold market, though it showed greater intraday volatility as it caught a tailwind from a late-day pullback in the U.S. Dollar Index.Derivatives & Options FlowOptions activity in SLV highlights a strong underlying bullish structural posture on the long-term ledger, even as shorter-term session trading turns more defensive:
- Session Volume Put/Call Ratio: Stood at 1.45 for the day. Total options activity registered 214.2K contracts, with a sharp intraday spike in protective put buying as silver prices tested their local lows.
- Open Interest (OI) Put/Call Ratio: Remains structurally low at 0.62. Similar to GLD, outstanding bullish call contracts drastically outnumber puts on the resting ledger, pointing to a persistent structural bias for precious metals over a multi-month horizon.
- Volatility Environment: Implied Volatility (IV) on the fund sits at 33.35%, mapping to an IV Rank of 23.47%. Silver's options premium continues to price in significantly sharper expected swings than gold.
Macro & Technical Mechanics
The underlying spot silver price settled near $51.35 per ounce. Silver faced an intense macro headwind earlier in the week following hotter-than-expected September CPI (3.7% YoY) and PPI reports, which spiked treasury yields. However, as the 10-year Treasury yield softened back down to 5.09% on Friday, non-yielding precious metals found near-term technical support.
Because silver carries a dual identity as both a monetary safe haven and a primary industrial metal, its price action continues to navigate a structural tug-of-war between defensive gold-driven flows and industrial demand concerns stemming from the severe pullback in the tech and semiconductor sectors (such as the SOX index dropping 3.83%).
Copper
Bitcoin
Bitcoin
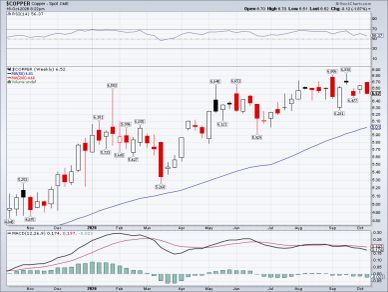
Copper was Down 1.87% last week.
P&F charts have copper going higher, to 7.25
Dr. Copper, a signal for basic industrial growth.
Seasonal trends are UP-
October 20%
November 75%
December 75%
The COMEX Copper Futures (front-month) settled at $6.53 per pound on Friday, October 16, 2026. While the metal managed a fractional gain of 0.30% (+1.95 cents) on the day to snap a three-session losing streak, it wrapped up the week 1.68% lower amid a broader broad-market liquidation and tech sector pullback. [1]
Derivatives & Options Profile (via CPER ETF)To track underlying sentiment and derivative trends for the industrial metals complex, investors look to the United States Copper Index Fund (CPER), which finished at $39.50 (+0.13%): [1]
- Put/Call Ratio Dynamics: The copper options complex continues to show a rising defensive bias. Over the last month, total open interest put/call ratios have steadily climbed, indicating that industrial manufacturers and macro managers are actively paying up for downside put walls to lock in profit lines.
- Volatility Environment: The CME Copper Volatility Index (CVOL) settled at 23.97%, showcasing a relatively stable, yet watchful risk outlook compared to the explosive volatility observed in technology shares. [1]
- ETF Range Boundaries: CPER carries an expense ratio of 0.88% and has mapped out a massive 52-week trading range of $30.43 to $41.52. [1, 2]
Structural Drivers & Macro ContextDespite the immediate weekly consolidation, copper prices remain historically elevated and trade just 4% below the record all-time high of $6.9285 reached on September 9, 2026. The structural bias remains firmly supported by a confluence of long-term factors: [1, 2]
- The AI Infrastructure Boom: Massive power grid buildouts required to sustain artificial intelligence data centers have significantly amplified global structural demand. [1]
- Global Supply Deficits: Operational mine disruptions across key South American corridors (such as labor negotiations at Escondida and logistical hurdles at Codelco) have kept global warehouse stock levels tightly constrained. [1, 2]
- Institutional Upgrade Cycle: Wall Street research desks have repeatedly raised their 2026 targets. Prominent firms like Macquarie and BMO Capital Markets now model copper prices averaging over $13,500 per metric tonne. [1]
Bitcoin
Bitcoin
Bitcoin
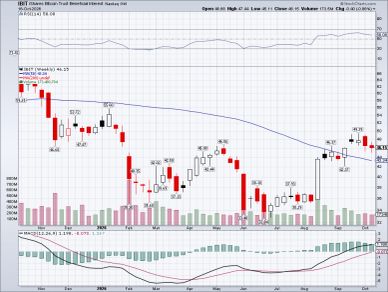
Bitcoin was Down .86% last week.
Bitcoin put in a Top signal, but still above the 50WMA.
P&F charts still have IBIT going UP to a target of 72.
3 years of seasonal trends show
UP
October 67%
November 50%
December 0%
The War/Iran/Oil issues continue to keep uncertainty alive. Seasonal patterns do not mean a lot right now.
The iShares Bitcoin Trust ETF (IBIT) dropped 0.94% (-$0.44) to close at $46.15 on Friday, October 16, 2026. The pullback tracked a softer session for spot Bitcoin, which oscillated around $81,614 amid broad-market risk-off sentiment and a temporary cooling of institutional inflows. [1, 2, 3]
Derivatives & Options FlowOptions volume surged well above historical benchmarks as traders scrambled to adjust their exposure ahead of the weekend:
- Session Volume Put/Call Ratio: Jumped to 1.38 [1.34]. Total daily options volume exploded to 870,167 contracts—outstripping its 30-day average of ~690K—with protective put buying (504,036 contracts) significantly outpacing bullish call buying (366,131 contracts) [1.34].
- Open Interest (OI) Put/Call Ratio: Holds a longer-term structural baseline of 0.7 to 0.84 [1.33, 1.35]. While the immediate daily session volume was heavily defensive, the resting ledger remains call-skewed due to multi-month institutional positioning [1.33].
- Volatility Environment: The 30-day Implied Volatility (IV) on the fund is hovering at 34.16% [1.26].
Fund Flows & Structural Data
- Lead in Redemptions: IBIT led a wider crypto fund exit on Friday, recording a daily net outflow of $71.78 million. Because spot ETFs are reactive open-ended trusts, BlackRock subsequently sold an identical $71.78 million worth of underlying physical Bitcoin to settle customer cash redemptions. [1, 2]
- Weekly Performance Summary: The single-day redemption contributed to a total weekly outflow of roughly $165 million for IBIT during the five trading days ending October 16. [1]
Core Metrics: Despite the minor weekly stumble, IBIT remains the largest spot digital asset trust in the world, holding $66.4 billion in net assets representing over 804,232 BTC secured via Coinbase Custody. [1, 2]
.