Markets 9.13.2026
SP 500
SP 500
SP 500
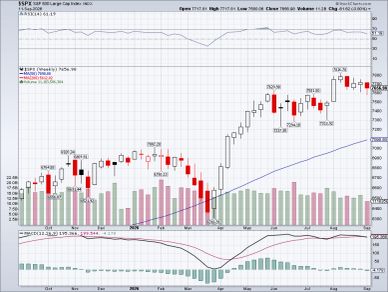
The SPX weekly chart was Down .80% last week.
SPX looks to be at a Top on the weekly charts for 5 weeks now. Daily charts are bouncing higher as of Thursday. Sunday night news/Iran oil, has the SP500 down .49%.
5 year seasonal trends have the SPX are
Sept. Oct up 50%
November UP 100%
December Up 2%
P&F charts for the SPX are still, going UP to 8749.
The S&P 500 Index ($SPX) put/call volume ratio hovers near 1.60, and the open interest ratio sits around 1.38. A ratio above 1.0 means traders buy more put options than call options, which usually points to a cautious or bearish market mood.
(These charts are based on basic price trends and trading volume. They are not an exact science 100% of the time, but a very worth while stock market gauge. Fundamentals are earnings and sales, and sometimes these trend charts reveal a truth perhaps hidden by accounting statements)
If you want to own this web sight, make me an offer. (at least $20,000,000)
QQQ
SP 500
SP 500
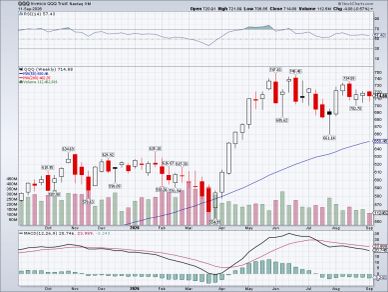
The QQQ was Down .57% last week. QQQ looks the same as the SPX.
P&F charts have changed again, QQQ still going Down to 676.
Seasonal trends for the past 5 years show QQQ Up 50% of the time in , September and October. November is UP 75%, similar to the SPX.
The put-to-call ratio for Invesco QQQ Trust (QQQ) sits around 1.35 based on open interest, and 1.26 volume ratio, this is lower than last week, thus more normal, less bearish..
I call this DAY TRADERS PARADISE, and that statement continues.
Semis
SP 500
Consumer Discretionary
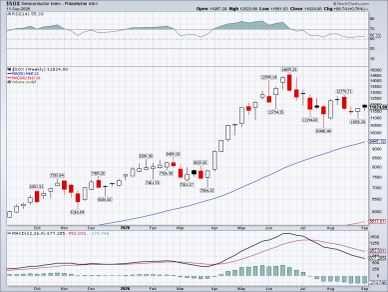
The SOX was Up .76% last week.
P&F charts are now pointing higher, a change from last week, to 13,849.
5 year seasonal trends show SEMIs higher 50% of the time from September until November, then Up 75% of the time in December.. Thus we are entering the worst month for Semis and not much of a Upside until December.
The put/call ratio for the iShares Semiconductor ETF (SOXX), a primary proxy for the PHLX Semiconductor Index ($SOX), stands at approximately 1.34 for open interest and 1.03 for daily volume, less bearish than last week.
I call this DAY TRADERS PARADISE, and that statement continues.
Consumer Discretionary
Consumer Discretionary
Consumer Discretionary
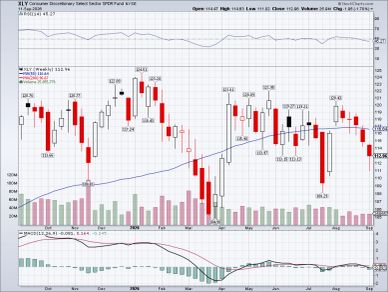
XLY was Down 1.70% last week.
XLY is looking to maybe be at a low on the weekly charts, and moving higher off of a low on the daily charts. The range of 105-121 has been on since April.
Seasonality has XLY up .
50% of the time in Sept/Oct. then 75% Nov/Dec.
P&F charts are pointing lower to 87.
The Consumer Discretionary Select Sector SPDR Fund (XLY) recently trades with an options put/call open interest ratio around 2.87 and daily volume ratios averaging near 2.1. These are normal reading for XLY with some bearish fear still around.
When evaluating sentiment on XLY, it is crucial to remember its severe mega-cap concentration. Because it is a market-cap-weighted portfolio pulling from the S&P 500, broad retail and consumer discretionary options flow is heavily dominated by just a couple of core entities: [1, 2]
- Amazon (AMZN): Controls roughly 24.58% of the entire ETF weight.
- Tesla (TSLA): Comprises roughly 17.95% of the fund. [1]
Together, just these two stocks dictate over 42% of XLY's movement. The remainder of the sector's options exposure is distributed across more traditional retail and experiences giants, led by Home Depot (HD) at 5.35%, McDonald's (MCD) at 4.07%, and Booking Holdings (BKNG) at 3.50%
Minimum wage for me is $5,000,000,000. Based on my BS MS ACT GMAT%, efforts, american Pay check/business license precedents.
Energy
Consumer Discretionary
Junk Bonds
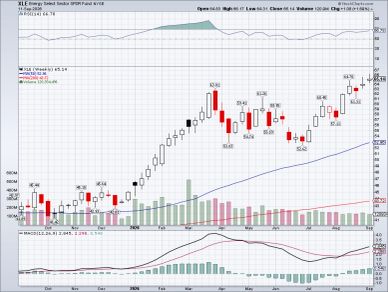
The XLE was Up 1.69% last week.
Oil moves on peace treaties on or off with Trump/Iran. This has been so for months. Do not count on anything for now.
Sunday night 6.30pm shows futures higher for Oil with Saudi Arabia shutting down a pipeline that bypasses the strait of Hormuz. This news is lowering the SPX DIA and QQQ a lot.
P&F charts are reversed again pointing higher to 92.
The Energy Select Sector SPDR Fund (XLE) shows a volume put-call ratio around 1.59 and an open interest put-call ratio around 1.66, reflecting defensive positioning.
Junk Bonds
Consumer Discretionary
Junk Bonds
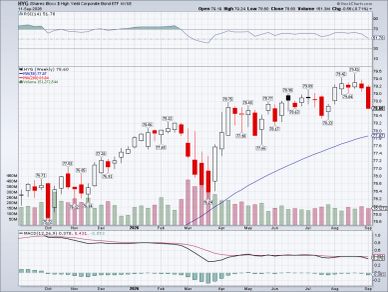
HYG Junk, high yield bonds, indicating Risk 'on' or 'off'.
HYG was Down .71% last week. This market is not predictable with international conflicts/news/on/off.
Seasonal trends are up 50% of the time in September, then only 25% in October. Up 100% in Nov, then only 25% in Dec.
P&F charts are looking to go Up higher, the same as last week's target, to 107.
The volume put-call ratio for the iShares iBoxx $ High Yield Corporate Bond ETF (HYG) sits around 3.57, while open interest put-call ratios near 6.71
, reflecting a predominantly bearish market sentiment where investors actively favor protective or speculative puts over calls.
20 Year Treasury Bond
20 Year Treasury Bond
20 Year Treasury Bond
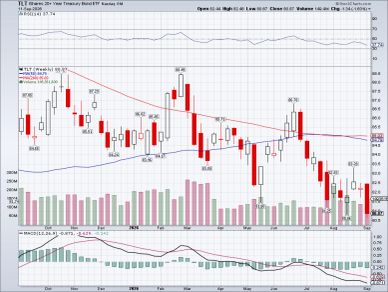
The TLT goes UP when interest rates are going lower, and the SPX generally goes UP with the TLT these days.
TLT was Down 1.63% this week.
P&F charts still have a Bearish target of 76.
Seasonal trends are
September- up 50%
October 25%
November 100%
December 25%
The iShares 20+ Year Treasury Bond ETF (TLT) options market displays an overall volume put-call ratio of approximately .58, with overall open interest ratios hover near 0.60
reflecting a steadier longer-term bullish or accumulation baseline.
Traders actively bought nearly twice as many calls as puts, positioning heavily for a drop in long-term Treasury yields (which moves inversely to bond prices
Volatility Index
20 Year Treasury Bond
20 Year Treasury Bond
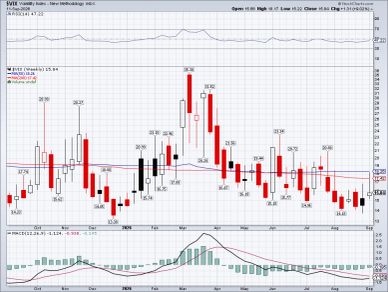
$VIX- increases in Volatility lead to lower stock prices.
VIX was Up 9.02% last week.
P&F charts have a big change now with volatility going Up to 25.5. (higher target. lower stock prices)
Oil and Iran issues bad/good move volatility, as well as the unwinding of AI hype.
Seasonal trends show VIX up
100% in September
75% in October
0% in November
50% In December
The VIX Put/Call Ratio stands at .43 on volume, .34 Open Interest. This indicator measures the ratio of put options to call options traded on the Cboe Volatility Index ($VIX). The low ratios indicate Calls are favored, thus higher volatility and lower stock prices.
Gold
20 Year Treasury Bond
Silver
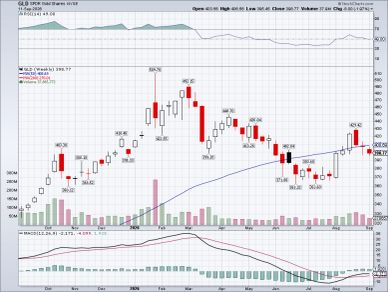
Gold was Down 1.97% last week.
Gold dropped below support on the 50WMA.
Weekly charts are pointing lower for Price of gold. Mixed signals are on these indicators.
P&F targets are another big change, now lower to 377.
Seasonal trends show Gold UP-
September 50%
October 75%
November 75%
December 75%
The SPDR Gold Shares ETF (GLD) shows an open interest put-call ratio around 0.46 and volume ratios frequently tracking near 0.79. This indicates heavier call trading and a bullish market sentiment, as traders favor upside participation or gold price strength over downside protection.
Silver
Bitcoin
Silver
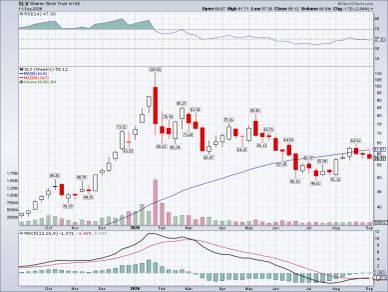
Silver was Down 2.84% last week.
P&F charts remain the same as last week, SLV UP to 88.
SLV looks to go lower with GLD, or this is a pause before moving higher.
Seasonal 5 year trends are Silver UP
September 75%
October 100%
November 75%
December 50%
The open interest put/call ratio for the iShares Silver Trust (SLV) sits around 0.44, meaning call open interest heavily outnumbers put open interest. This lower ratio generally points to a more bullish or upside-participatory market alignment among current option holders.
Copper
Bitcoin
Bitcoin
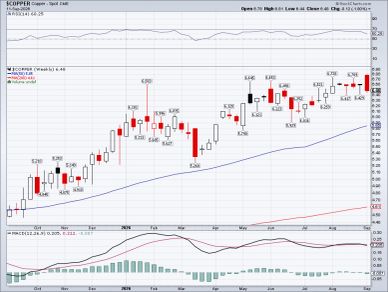
Copper was Down 1.80% last week.
P&F charts have copper going higher, to 7.25
Dr. Copper, a signal for basic industrial growth.
Seasonal trends are UP-
September 50%
October 25%
November 75%
December 75%
The United States Copper Index Fund (CPER) has a very low put-call ratio of .16, meaning traders buy far more call options than put options. This shows strong bullish market interest in copper prices.
Bitcoin
Bitcoin
Bitcoin
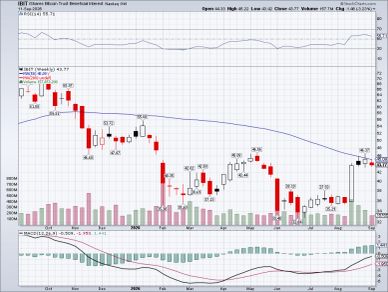
Bitcoin was Down 3.23% last week.
Bitcoin surged UP 2 weeks ago, but held below the 50WMA resistance again this week.
P&F charts still have IBIT going UP to a target of 72.
3 years of seasonal trends show
UP
September 100%
October 50%
November 50%
December 0%
The overall volume put/call ratio for the iShares Bitcoin Trust ETF (IBIT) sits at approximately .75, indicating bearish market sentiment while the open interest ratios is .70. These ratios reflect a bullish outlook by traders for a higher Bitcoin price..
The War/Iran/Oil issues continue to keep uncertainty alive. Seasonal patterns do not mean a lot right now.
.