Markets 10.30.2026
SP 500
SP 500
SP 500
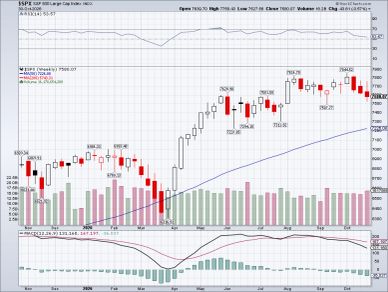
The SPX weekly chart was Down .57% last week.
The weekly and monthly charts look to be moving lower off of the recent highs. Daily charts are perhaps oversold and ready to bounce, as Sunday night futures are UP, and Oil is down.
This week has elections, more earnings, jobs report to move stocks with oil/war issues.
5 year seasonal trends have the SPX are
November UP 100%
December Up 25%
January-Up 80%
P&F charts for the SPX are still, going UP to 8199, a lower high than last week.
As of market close on Friday, October 30, 2026, the CBOE SPX Put/Call Ratio sits at 1.25. [1]This reflects a standard daily reading for the S&P 500 Index options, which historically trend higher than 1.0 because institutions primarily utilize SPX puts as systemic portfolio hedging vehicles. Over the final sessions of October, the intraday session ratios hovered between 1.10 and 1.15, reflecting a standard level of caution without signaling extreme panic or capitulation. [1, 2, 3]Key Options Metrics & ContextTo get an accurate view of broader market sentiment, it helps to isolate pure equity sentiment from index hedging data:
- SPX Open Interest (OI) Ratio: The structural Put/Call OI ratio sits at 1.45, with total outstanding puts significantly outnumbering calls. This confirms that institutional protective floors remain firmly built into the options chain. [1, 2]
- Equity-Only Put/Call Ratio: At 0.66, the CBOE Equity-Only Put/Call Ratio (which tracks individual stocks and strips away broad index hedges) indicates robust upside speculative activity and individual stock optimism. [1]
- Overall Index Ratio: The aggregate CBOE Index Put/Call Ratio tracked at 1.10 at the close of the final October session. [1]
In the framework of contrarian indicators, an SPX volume ratio exceeding 1.20 usually points to an elevated baseline of fear or structured macro hedging. However, historical context reveals that the index-level put/call ratio has structurally compressed over the last few years—dropping from an average near 1.76 down toward a baseline average of 1.17 in recent months—driven heavily by high volumes of zero-day-to-expiry (0DTE) call options chasing market momentum. [1, 2, 3, 4, 5, 6]
(These charts are based on basic price trends and trading volume. They are not an exact science 100% of the time, but a very worth while stock market gauge. Fundamentals are earnings and sales, and sometimes these trend charts reveal a truth perhaps hidden by accounting statements. The options data is assumed to be accurate, but with a caution that many times exact numbers are not always 100% correct. The options data reveal information that can be useful in determining stock market, ETF, individual stock direction. Nothing is 100% accurate 100% of the time, nothing is in life...)
If you want to own this web sight, make me an offer. (at least $20,000,000)
QQQ
SP 500
SP 500
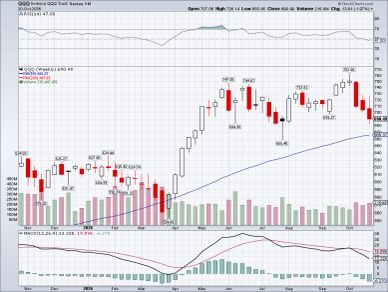
The QQQ was Down 1.97% last week.
QQQ look similar to the SPX with more downside risk after a bounce with the AI/SEMI stocks retreat.
P&F charts have changed again, QQQ going Down lower to 656.
Seasonal trends for the past 5 years show QQQ Up -
Nov. - 75%
Dec. - 50%
Jan.- 80%
As of market close on Friday, October 30, 2026, the Invesco QQQ Trust ETF closed at $690.49, down 3.47% in a single session. Tech and growth sectors faced a sharp drawdown over the final week of October, primarily driven by concentrated AI infrastructure spending anxieties following Big Tech earnings releases. [1, 2]
Options Sentiment & MetricsFollowing the sharp sell-off, broad defensive positioning has accelerated significantly across Nasdaq-100 index products:
- Put/Call Volume Ratio: The daily volume ratio shot up to 1.63 on Friday, with 2,001,355 puts traded against 1,230,925 calls. This represents a heavy intraday spike in protective volume as participants aggressively bought short-term downside protection. [1]
- Open Interest (OI) Put/Call Ratio: The structural 30-day Open Interest ratio stands at 1.40. Large-scale institutional hedges are firmly locked in place around standard downside strikes. [1]
- Options Premium Flow: Order flow monitoring captured an extreme tilt on Thursday and Friday, with puts commanding up to 89.6% of total institutional options premiums ($620.9M in put premium vs. $71.77M in call premium) during peak macro blocks. [1]
Volatility & Technical Structure
- 52-Week Range Boundaries: QQQ remains roughly 10.5% below its all-time closing high of $759.66 reached on October 06, 2026, while remaining well above its 52-week low of $555.60. [1]
- Implied Volatility (IV) Reset: The At-The-Money (ATM) Implied Volatility collapsed by roughly 3% down to 20.6% directly after the binary earnings announcements cleared on Friday. This volatility crush squeezed premium out of long options contracts, despite the steep drop in the underlying price. [1]
Semis
SP 500
Consumer Discretionary
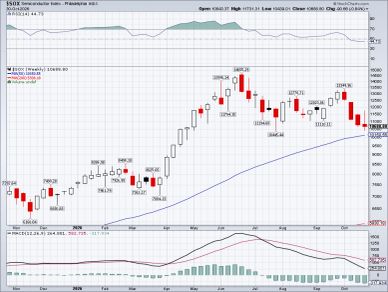
The SOX was Down .84% last week.
SOX has dropped, still above the 50WMA which might be a bottom for now.
P&F charts are still pointing lower, Down lower than last week to 9151. The P&F charts are changing signals almost weekly, thus as a long term target, are not of much use now.
5 year seasonal trends show SEMIs higher
Nov.- 50%
Dec.- 75%
Jan.- 80%
Following the deep contraction across macro tech products, the semiconductor complex suffered the brunt of the final October sell-off. As of the market close on Friday, October 30, 2026, the PHLX Semiconductor Index (^SOX) plunged 7.20% in a single session, closing at 10,688.80. This capstone decline extended a punishing multi-week correction that has pulled the premier chip index down 15.36% over the last month, wiping out a massive chunk of its autumn momentum following concerns over heavy AI data-center capital expenditure paths and near-term supply chain shifts. [1, 2]Semiconductor Sector Options SentimentBecause the underlying index (^SOX) does not support a direct, high-volume retail options market, institutional and proprietary desks express their positioning and tail-hedging through liquid ETF sector proxies—predominantly SOXX (iShares Semiconductor ETF) and SMH (VanEck Semiconductor ETF): [1]
- SOXX Put/Call Volume Ratio: The immediate daily volume ratio exploded to 2.35, demonstrating panic-driven buying of short-term puts as standard floor protections failed during Friday's intraday decline. [1]
- SOXX Open Interest (OI) Put/Call Ratio: Structural hedging configurations show a Put/Call OI ratio of 1.93 (scaling up to 2.10 on select front-month tenors). Total open puts vastly outnumber call configurations, signaling that desks are aggressively maintaining a defensive perimeter for the sector heading into November. [1, 2]
- SMH Put/Call Volume Ratio: Mirroring the panic in SOXX, SMH options saw a volume ratio peak of 2.52 during the final hours of October trading, with institutional flow commanding heavy premium outlays for downside protection. [1]
Under the Hood: Technical DamagesThe index's drop to 10,688.80 marks a notable breakdown from its late-summer structure. Just weeks prior, on October 06, 2026, the SOX index was trading at a multi-month high of 13,217.82. The subsequent retreat means the semiconductor sector has entered a definitive technical correction phase, sitting roughly 19.1% below its early October peak. Despite the heavy structural damage done to trailing monthly charts, the index preserves a solid Year-to-Date (YTD) return of +49.10%, illustrating how parabolic the sector's performance had run prior to this clearing event. [1, 2]
Consumer Discretionary
Consumer Discretionary
Consumer Discretionary
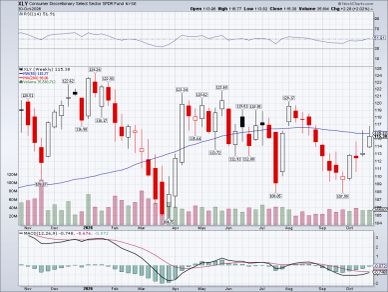
XLY was Up 2.02% last week.
XLY has been an alternative to AI stocks, rising for 5 weeks. In a 'bear market' on the daily charts, hitting overhead resistance on the 50WMA. If AI breaks the drop, will XLY go back down or remain the sector to go to.
Seasonality has XLY up .
Nov.- 75%
Dec.- 75%
Jan.- 60%
P&F charts are pointing lower to 87.
At the market close on Friday, October 30, 2026, the Consumer Discretionary Select Sector SPDR Fund (XLY) closed at $115.38, dropping 0.71% during the final session. In contrast to the heavy liquidation seen in technology and semiconductor sectors, the consumer discretionary sector displayed relative resilience. XLY was buoyed by strong earnings reactions from heavyweight cyclical components, balancing out broader market headwinds. [1]
Options Volume & Sentiment StructureWhile the broader index benchmarks faced aggressive defensive overhauls, positioning across the discretionary sector stayed closer to historical baselines:
- Put/Call Volume Ratio: The closing daily option volume ratio settled at 1.31 (with 191 puts traded against 146 calls on the final day), showcasing a mild, expected weekend hedging bias rather than an unhinged flight to protective puts. [1]
- Open Interest (OI) Profile: The structural 120-Day Put/Call OI ratio sits at 1.53. This indicates a persistent, slow-moving accumulation of institutional inventory floors to insulate large portfolios against holiday spending updates. [1]
- Implied Volatility Constraints: The sector’s 30-day implied volatility (IV30) stayed stable at 19.2%, indicating that options premium prices are not pricing in extreme systemic panic for retailers. [1]
Concentration Risk & Key DriversBecause XLY utilizes a market-cap-weighted structure, its overall directional movement is heavily tied to its top structural anchors rather than a broad, organic retail consensus: [1]
- The Top Two Anchor Weights: Amazon (AMZN) at ~23.3% and Tesla (TSLA) at ~18.2% account for more than 41% of the total exchange-traded fund. This means corporate developments at these two entities dictate XLY's path far more than traditional high-street retail stores. [1]
Technical Trading Range: The final close at $115.38 places the fund in a strict consolidation boundary—sitting roughly 7.7% below its 52-week high of $125.01 and holding comfortably above its 52-week floor of $105.19.
Minimum wage for me is $5,000,000,000. Based on my BS MS ACT GMAT%, efforts, american Pay check/business license precedents.
Energy
Consumer Discretionary
Junk Bonds
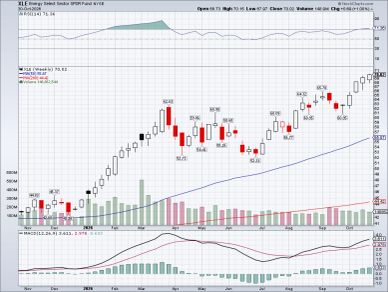
The XLE was Up 1.00% last week.
Oil moves on peace treaties on or off with Trump/Iran. This has been so for months. Do not count on anything for now.
P&F charts are pointing higher to 74.
.
At the market close on Friday, October 30, 2026, the Energy Select Sector SPDR Fund (XLE) closed at $70.02, climbing 1.91% in a standout session. While technology, semiconductor, and macro index benchmarks suffered deep contractions during the final week of October, the energy complex bucked the selling trend. A surge in crude oil prices driven by structural geopolitical disruptions, alongside robust quarterly earnings from core integrated supermajors like ExxonMobil and Chevron, provided definitive sector-specific support. [1]
Options Volume & Sentiment BreakdownOptions market positioning shows that even as the fund rallied to near-term highs, institutional participants heavily reinforced their protective layers:
- Put/Call Volume Ratio: The aggregate daily volume put-call ratio settled at 1.40, with defensive options volume tracking closely to historical averages. Intraday expirations for the final October session saw a steeper put concentration of 1.65 as market participants bought short-term downside blocks to lock in weekly gains. [1]
- Open Interest (OI) Cushion: The structural Open Interest put-call ratio stands at 1.63. This heavy structural bias reflects broad institutional architecture, where desks routinely carry extensive long-dated put positions to insulate macro portfolios against commodity shocks. [1]
- Implied Volatility (IV) Mechanics: The fund's 30-day implied volatility rests at 26.49%, corresponding to a very low IV Rank of 5.96%. This reveals that despite the underlying price appreciation and macro volatility elsewhere, options premium costs are not inflated, keeping downside protection relatively inexpensive. [1]
Under the Hood: Concentration and Technical BoundariesXLE’s unique market-cap-weighted indexing creates an exceptionally top-heavy profile, making it behave less like a diverse basket and more like a concentrated vehicle:
- The Supermajor Anchor: ExxonMobil (XOM) at ~24.2% and Chevron (CVX) at ~18.3% together control over 42.5% of the total fund exposure. Consequently, XLE's directional bias is tightly bound to the cash flow, production profiles, and refining margins of these two entities. [1, 2]
Technical Milestone Bounds: The final print at $70.02 marks a fresh structural milestone, with the fund closing virtually at its 52-week high of $70.15. This caps off an exceptionally powerful cyclical run, leaving the fund trading far above its 52-week floor of $43.19.
Junk Bonds
Consumer Discretionary
Junk Bonds
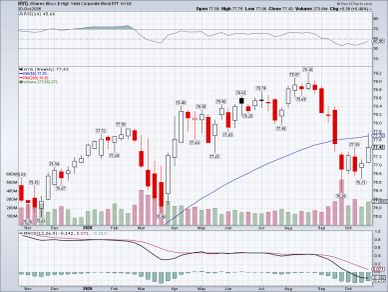
HYG Junk, high yield bonds, indicating Risk 'on' or 'off'.
HYG was Up .49% last week.
HYG has held steady and was UP some last week, a positive indication for the markets.
Seasonal trends are Up -
Nov.- 100%
Dec.- 50%
Jan.- 80%
P&F charts are looking to go Up to 74 (already met).
At the market close on Friday, October 30, 2026, the iShares iBoxx $ High Yield Corporate Bond ETF (HYG) closed at $77.43, sliding slightly by 0.19% on the day. In a week where major equity indexes and tech funds faced aggressive, double-digit pullbacks, high-yield corporate credit held up with immense stability. This indicates that fixed-income investors are absorbing equity market jitters without immediately panicking over systemic corporate credit risk.
Options Sentiment & Volume SpikesDespite the relative calm in HYG's underlying price, options markets saw highly concentrated bearish and protective trading blocks as institutions rushed to hedge cross-asset risks:
- Put/Call Volume Ratio: The aggregate daily put/call volume ratio sits around 1.32 across all tenors. However, specific front-month contracts experienced staggering volume skews; for instance, the expiring October 30 weekly block hit a temporary volume ratio of 6.32, indicating heavy tactical hedging during the final hours of October trading. [1, 2]
- Structural Open Interest (OI) Wall: The aggregate Put/Call OI ratio is highly elevated at 2.87. Total outstanding positions reflect 7,136,101 open puts compared to just 2,487,537 open calls, proving that macro traders utilize HYG options aggressively as a liquid proxy to protect against credit spreads widening. [1]
- Implied Volatility (IV) Profile: The fund's implied volatility hovers at 6.60% with a relatively low IV Rank around 29%. This reveals that despite the heavy put-buying volume, the overall market is not pricing in a systemic corporate default scare, keeping the cost of portfolio insurance relatively cheap. [1]
Key Distributions & Fund Structure
- Fresh Dividend Boost: On October 30, 2026, HYG officially declared its monthly cash dividend distribution of $0.4014 per share (payable on November 05). This marks an increase of approximately $0.0598 from its prior monthly payout. [1]
- Robust SEC Yield Floor: Backed by higher-for-longer macro interest rates, HYG features a lucrative 30-day SEC Yield of 7.38% alongside a trailing 12-month distribution yield of 6.07%. [1]
- Trading Range Boundaries: HYG remains pinned in a tight technical band, operating within a 52-week range of $76.39 to $81.28.
20 Year Treasury Bond
20 Year Treasury Bond
20 Year Treasury Bond
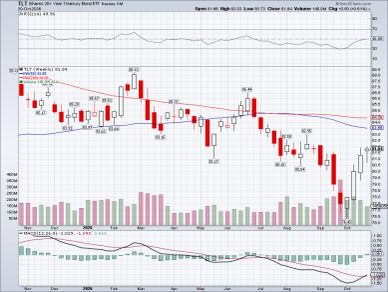
The TLT goes UP when interest rates are going lower. The moves lower may be about to reverse higher/lower rates, higher stock prices.
TLT was Up .61% this week.
TLT looks to be moving higher from lows 4 weeks ago.
P&F charts still have a Bearish target of 76.
Seasonal trends are
November 100%
December 25%
January- 40%
At the market close on Friday, October 30, 2026, the iShares 20+ Year Treasury Bond ETF (TLT) closed at $81.84, gaining 0.43% during the final session. Long-duration government debt managed to mount a subtle rebound alongside a sharp tech sector drawdown, providing a traditional multi-day safe-haven hedge for macro asset allocators. [1]
Options Volume & Structural SentimentWhile equities faced defensive restructuring, the sentiment configurations within bond options signaled a notable pivot toward upside exposure:
- Put/Call Volume Dynamics: Options flow registered an overwhelmingly bullish bias during the final hours of October, printing an intraday call option outperformance that compressed recent put metrics. Total option breakdowns showed massive institutional blocks flowing into long calls over puts. [1, 2]
- Structural Open Interest (OI) Profile: The 30-day Open Interest put/call ratio settled down to 0.51, confirming that outstanding calls significantly outnumber downside protective puts. [1]
- Implied Volatility (IV) Baseline: The fund's 30-day option implied volatility is resting quietly at 13.0%. This places it comfortably within its stable 52-week parameters (ranging from 9% to 16%), meaning traders are not expressing panicky or volatile assumptions regarding the immediate outlook for long bond yields. [1]
Record Supply vs. Yield PressuresThe relative stability of the bond fund is particularly striking given massive fiscal headwinds hitting fixed-income markets simultaneously:
- Record Treasury Supply: The U.S. Treasury recently sold a historic $839 billion of debt across 11 separate auctions in the final full week of October. While such a massive surge in supply would traditionally trigger lower bond prices, strong absorption from institutional desks allowed TLT to gain roughly 0.6% on the week.
- Yield Compression: The benchmark 10-year Treasury par yield responded to the asset reallocations by compressing down to 4.94%, pulling back from its recent intraday multi-month highs near 5.05%.
- Fresh Cash Distribution: On October 30, 2026, TLT officially declared its monthly cash dividend distribution of $0.3432 per share (payable on November 05). This highlights a steady yield footprint, pushing the current 30-day SEC yield to 5.32% and its 12-month trailing baseline to 4.78%.
- Trading Floor Geometry: The closing price of $81.84 leaves TLT operating in the lower half of its yearly framework, hovering above its 52-week low of $76.43 while remaining well insulated from its 52-week ceiling of $90.86. [1, 2, 3]
Volatility Index
20 Year Treasury Bond
20 Year Treasury Bond
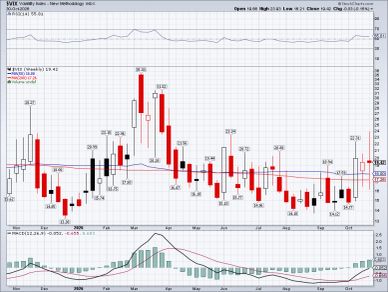
$VIX- increases in Volatility lead to lower stock prices.
VIX was Down .15% last week.
After spiking to a new high (for the month) the VIX settled lower. Volatility looks to be around for the near future.
P&F charts have changed again now with volatility going Up to 25.5, (higher target. lower stock prices, back and forth over these past weeks)
Oil and Iran issues bad/good move volatility.
Seasonal trends show VIX up
November - 0%
December- 50%
January- 60%
At the market close on Friday, October 30, 2026, the CBOE Volatility Index (^VIX) spiked 12.91%, closing at 19.42. This rapid expansion capped off a multi-day surge as broad market liquidations across the technology and semiconductor sectors sent risk assets lower, forcing macro traders to aggressively price in near-term downside protection. [1, 2]
VIX Options Volume & Sentiment BreakdownOptions activity on the VIX itself behaves inversely to traditional equities, as traders buy VIX calls to position for or hedge against an accelerating stock market decline:
- VIX Put/Call Volume Ratio: The closing daily option volume ratio printed at 0.47. In the context of the volatility index, a low put-call ratio below 0.50 reflects a heavy call option dominance, signaling that institutional desks are heavily positioning for higher volatility or protecting broader portfolios against additional equity drawdowns. [1, 2]
- Intraday Premium Flows: Aggressive block sweeps targeted short-term calls throughout Friday's session. Front-week contracts expiring in early November showed a heavy concentration of call volume with volume ratios plunging near 0.06 to 0.09 on specific short-term tenors. [1]
- Open Interest (OI) Footprint: The longer-term structural Open Interest put-call ratio remains anchored at 0.34. This confirms that a steady, overarching layer of long call exposure remains the default architecture for macro portfolios navigating late autumn tail risks. [1]
Technical Bounds & Volatility Landscape
- Intraday Peak Range: Volatility saw massive fluctuations during the final session of October, printing a daily range of 18.03 to 23.93. The push up to 23.93 represented an immediate breach of the key psychological 20-level barrier before cooling slightly into the final bell. [1]
- Yearly Parameters: At 19.42, the index is trading well above its 52-week low of 13.38, yet remains within safe historical boundaries relative to its 52-week ceiling of 35.30. [1]
- The Volatility of Volatility (^VVIX): Reflecting the speed of Friday's premium repricing, the VVIX index (which measures the volatility of VIX options themselves) surged 8.59% to close at 106.43, pointing to highly dynamic premium forecasting among market makers. [1]
Gold
20 Year Treasury Bond
Silver
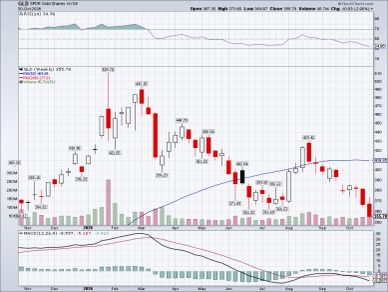
Gold was Down 2.95% last week.
P&F targets are still lower this week to 369.
Gold looks to go lower.
Seasonal trends show Gold UP-
November 75%
December 75%
January- 60%
At the market close on Friday, October 30, 2026, the SPDR Gold Shares ETF (GLD) settled at $355.78, down 3.47% in a single session. Gold suffered its sharpest liquidations in months as intensifying cross-asset volatility, surging bond yields, and expectations of an incremental interest rate hike catalyzed severe technical profit-taking across precious metals. [1]
Options Volume & Sentiment BreakdownDespite the rapid liquidation in spot gold bullion, option configurations show that institutional participants have not fully abandoned their upside baseline bias, maintaining notable long exposure:
- Put/Call Volume Ratio: The immediate daily options volume ratio settled at 0.62, with calls outstripping puts despite the steep single-day descent. This lower-than-average put volume reveals tactical buyers accumulating calls near new support zones rather than panicking. [1]
- Structural Open Interest (OI): The longer-term structural Open Interest put-call ratio sits firmly at 0.48. This reading establishes that structural call configurations comfortably triple outstanding defensive floor positions across intermediate horizons. [1]
- Implied Volatility (IV) Mechanics: GLD's 30-day implied volatility hovered around 20.07%. While ticking up marginally from trailing monthly baselines, premium pricing has not expanded into a full capitulation zone. [1]
Fundamental Anchors & Technical Boundaries
- Fresh 52-Week Lows: The closing flush to $355.78 officially registers as a fresh 52-week low for GLD, dropping below its trailing baseline average of $408.67 and sitting roughly 30.8% below its all-time high of $514.17 achieved early in the year. [1, 2]
- Bullion Settlement Context: Underneath the exchange-traded wrapper, the tracking benchmark LBMA Gold Price PM settled at $4,026.30 per ounce, down 3.0% on the day as physical bullion tested major psychological parameters below the $4,100 boundary. [1, 2]
- Scale of Capital Reserves: GLD preserves its crown as the absolute benchmark vehicle for institutional gold access, holding $131.0 billion in total net assets under management (AUM) backed by fully allocated gold bars in secure London vaults. [1, 2]
Silver
Bitcoin
Silver
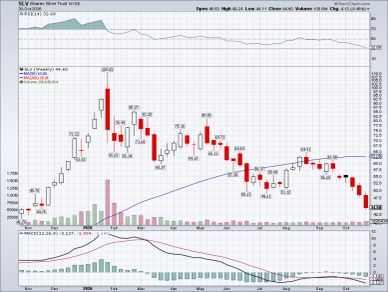
Silver was Down 8.46% last week.
P&F charts are the same, SLV lower to 52.
Silver looks to go lower.
November- 75%
December- 50%
January- 40%
At the market close on Friday, October 30, 2026, the iShares Silver Trust (SLV) closed at $44.60, tumbling 5.67% in a high-volume capitulation session. Mirroring the severe liquidations seen across the broader precious metals complex, silver fell to its lowest levels since late 2025. The asset is now trading 59.4% below its multi-year record high of $109.81 reached back in January 2026. [1, 2]
Options Sentiment & Volume ConfigurationsEven amidst a punishing multi-day downward flush, structural options data reveals that intermediate-to-long-term market participants are aggressively positioning for a cyclical floor, rather than buying defensive puts:
- Open Interest (OI) Put/Call Ratio: The foundational Put/Call OI ratio is highly optimistic at 0.41. Total outstanding call options comfortably more than double the entire outstanding put inventory, indicating that macro desks are viewing this correction as a deep accumulation zone. [1]
- Daily Volume Split: On the final trading day of October, the short-term tactical options put/call ratio hovered at 0.55. Calls continued to heavily outpace puts on the tape despite the -5.67% underlying price collapse, confirming a strong buy-the-dip bias among derivatives traders. [1, 2, 3]
- Implied Volatility (IV) Landscape: In step with the pricing drop, 30-day implied volatility moved higher to 33.9%. While premiums are expanding, they haven't reached a state of chaotic panic, keeping call options reasonably priced for contrarian bulls. [1]
Key Factors Behind the Metals Break
- December Rate Hike Pressures: According to the latest CME FedWatch data, the market is pricing in an aggressive 75% to 86% probability of an incremental interest rate hike in December. Higher structural yields drastically increase the opportunity cost of holding non-yielding hard assets like physical silver. [1]
- Industrial Demand Demolition: Precious metals are suffering from a dual headwind. From an industrial perspective, institutional reports from JPMorgan estimate that global solar-sector silver demand is projected to contract by 30% (roughly 60 million ounces). This threatens to transition silver's long-standing multi-year market deficit into a near-term oversupply. [1]
- The Gold-Silver Ratio Pivot: With gold settling near $4,010/oz and spot silver pressing down to $50.95/oz, the Gold-Silver Ratio has stretched to 80. Historically, a ratio at or above 80 frequently points to silver being deeply undervalued relative to gold, often acting as a precurs
Copper
Bitcoin
Bitcoin
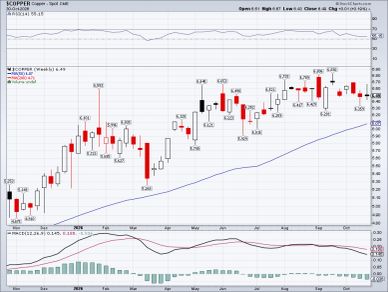
Copper was Down .19% last week.
P&F charts have copper going higher, to 7.75
Copper looks to stay in the range established for months.
Dr. Copper, a signal for basic industrial growth.
Seasonal trends are UP-
November 75%
December 75%
January - 80%
At the market close on Friday, October 30, 2026, COMEX Copper Futures (December contract) fell 1.83% to settle at $6.48 per pound. [1]Dr. Copper—traditionally monitored as a leading barometer for global economic health—experienced a sharp correlation breakdown over the final sessions of October. The primary catalyst was a deep technical pullback across the technology and AI infrastructure sectors, which directly dampened speculative sentiment surrounding near-term data center and power grid construction demand. [1, 2]Key Market Data & Proxy MetricsBecause physical futures contracts require specialized margin access, institutional and retail desks express tactical positioning through the primary liquid ETF wrapper, the United States Copper Index Fund (CPER): [1]
- CPER Settlement: The index tracking fund dropped 2.20% to close at $38.85, matching the high-volume breakdown triggering across global metals pits. [1]
- Derivatives Skew Momentum: In step with the broader asset liquidation, the short-term tactical options put/call volume ratio for CPER moved to 1.64. This indicates a highly defensive structural stance as institutional desks bought downside protective puts to insulate multi-asset industrial portfolios.
- Trading Parameters: Friday’s contraction pushed the commodity beneath its 61.8% Fibonacci retracement layer ($6.56), forcing copper to trade near the lower boundary of its standard 52-week parameters ($4.88 to $6.92). [1, 2]
Despite the short-term technical sell-off, copper's structural floor remains insulated by remarkably tight physical supply constraints: [1, 2]
- Record Physical Premiums: The Shanghai Yangshan copper premium skyrocketed to a 13-year high of $205 a ton. This confirms that physical import demand and spot delivery competitions remain exceptionally robust in Asia, heavily detached from the paper liquidation taking place on western exchanges. [1, 2]
- Supply Vulnerabilities: Major supply-side contractions have tightened inventory access. Global supply calculations were hampered by Chile's output dropping 15% year-on-year alongside recent processing disruptions at major operations like Rio Tinto's Oyu Tolgoi mine. [1]
Bitcoin
Bitcoin
Bitcoin
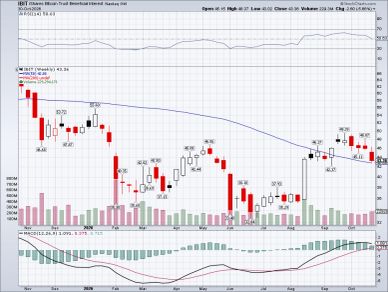
Bitcoin was Down 5.66% last week.
P&F charts still have IBIT going UP to a target of 72.
IBIT has mixed signals, price trends look to dominate lower.
3 years of seasonal trends show
UP
November 50%
December 0%
January - 33%
At the market close on Friday, October 30, 2026, the iShares Bitcoin Trust ETF (IBIT) fell 5.14%, closing at $43.36. The sharp drop matched a steep correction across cryptocurrency spot markets, which faced sudden risk aversion and heavy long liquidations over the final two sessions of October. [1, 2]
Options Sentiment & Volume SurgeDespite the severe downward momentum in underlying spot Bitcoin prices, derivatives activity reflects highly active, tactical trading rather than a structural panic shift: [1]
- Elevated Tape Activity: IBIT options volume surged to 1,473,752 contracts traded on Friday (775,075 calls and 698,677 puts), more than doubling its standard 30-day average volume of ~606,461 contracts. [1]
- Balanced Put/Call Volume Ratio: The closing daily option volume ratio printed at 0.90. This tells us that call volume continued to hold a minor edge on the tape despite the -5.14% decline, indicating active dip-buying and short-term premium collection rather than unhinged put chasing. [1]
- Structural Open Interest (OI) Anchor: The total structural Open Interest put/call ratio settled at 0.78 across the entire options chain. Outstanding upside calls continue to structurally outnumber downside puts, demonstrating that long-term participants are maintaining an optimistic baseline. [1]
Liquidation Waves & Asset Metrics
- Massive Capital Outflows: The sharp downturn triggered a major exit from digital asset wrappers. U.S. spot Bitcoin ETFs recorded a collective $643.33 million in net outflows on October 30—marking their toughest single-day performance since late June. BlackRock’s IBIT led the exit, suffering roughly $234 million in net withdrawals (~3,056 BTC returned). [1, 2, 3]
- Scale of Capital Reserves: Despite the single-day redemption spike, IBIT preserves its dominant position as the largest product in the digital asset landscape, carrying $67.1 billion in total assets under management (AUM) with a physical backing of 811,817 BTC held securely in trust custody. [1, 2]
- Yearly Boundaries: The final closing print of $43.36 keeps IBIT floating in the middle of its current annual parameters, sitting below its 52-week high of $63.03 while maintaining a safe distance from its 52-week low of $32.84.
The War/Iran/Oil issues continue to keep uncertainty alive. Seasonal patterns do not mean a lot right now.
.